Top 10 SEO Metrics Every SEO Dashboard Should Track in 2026
One of the biggest challenges facing SEO specialists is data fragmentation, valuable insights scattered across Google Search Console, Google Analytics 4, and third-party SEO tools like SEMrush, Ahrefs, and Moz.
The solution?
A centralized SEO dashboard that brings all your critical Key Performance Indicators (KPIs) together in one place for comprehensive performance tracking.
Platforms like Data Studio (formerly Looker Studio) make this possible, allowing you to connect multiple data sources and visualize your SEO performance holistically through business intelligence dashboards.
But which metrics truly matter?
With over 53% of all website traffic coming from organic search (BrightEdge, 2019), tracking the right Search Engine Optimization (SEO) metrics isn’t just helpful, it’s essential for competitive success.
In fact, 91% of digital marketers reported a positive impact from SEO on website performance and marketing goals (Conductor, 2025).
Let’s explore the top ten SEO metrics every comprehensive dashboard should track, complete with industry benchmarks and data-driven insights.
Quick Reference: Essential SEO Metrics Overview
| Metric | What It Measures | Why It Matters | Industry Benchmark |
|---|---|---|---|
| Organic Traffic | Unpaid visitors from search | Overall SEO effectiveness | 53% of total traffic |
| Keyword Rankings | Position in SERPs | Competitive standing | Top 3 = 42.3% of clicks |
| Organic Conversions | Goal completions from search | Business value and ROI | 2.7% average across industries |
| Organic Conversion Rate | % of organic visitors converting | Traffic quality | 2.7% average across industries |
| Backlinks | Inbound links to your site | Domain authority and trust | #1 result has 3.8x more backlinks |
| Share of Voice | Visibility vs. competitors | Market position | Varies by industry |
| Unique Query Count | Queries driving visibilities and traffic | Content breadth | Growing = topical authority |
| Unique Pages | Indexed pages getting impressions | Content visibility | Higher % = better indexing |
| Organic Revenue | Revenue from organic traffic | Financial impact | Varies by business model |
| Click-Through Rate (CTR) | % of impressions that click | SERP appeal | Position #1: 19% |
1. Organic Traffic
Organic traffic represents the number of visitors arriving at your site through unpaid search results, the foundation of SEO performance measurement.
This metric directly reflects the effectiveness of your optimization efforts and content strategy. With the top organic result receiving 19x more clicks than the top paid search result on average (AIOSEO), organic traffic remains the most valuable acquisition channel for sustainable growth.
Why It Matters
Since 75% of users never scroll past the first page of search results (HubSpot), your organic visibility directly impacts business opportunities. The top result on Google captures 27.6% of all clicks (Backlinko, 2024), making first-page rankings critical for traffic generation.
What to Track
Beyond the top-line number, your dashboard should segment organic traffic by:
- Landing page – Identify your traffic drivers and content opportunities
- Device type (mobile vs. desktop) – Understand how mobile optimization affects your audience
- Geography – Reveal where your geographical opportunities lie
- New vs. returning visitors – Gauge content discovery vs. loyalty
- Traffic source (Google vs. Bing vs. other search engines)
Actionable Insights
Comparing organic traffic trends against search visibility and CTR helps you identify whether traffic changes stem from ranking fluctuations, shifting search behavior, or SERP feature changes like AI Overviews and featured snippets.
Red flag: Declining traffic with stable rankings suggests CTR issues or increased competition from SERP features.
Opportunity: Growing impressions but flat traffic indicates CTR optimization potential.
2. Keyword Ranking Positions
While SEO has matured beyond obsessing over individual rankings, keyword position tracking remains essential for understanding your competitive standing in Search Engine Results Pages (SERPs) and identifying optimization opportunities.
Your dashboard should track rankings for your target keywords, monitoring both current positions and movement over time.
The 2026 Ranking Reality
Traditional click-through patterns have shifted significantly.
While position #1 historically captured 28% of clicks, the rollout of AI Overviews has reduced this to approximately 19%, a 32% decline from 2024 to 2025 (GrowthSRC, 2025).
Despite this change, the combined top 3 organic search results that used to capture 61.4% of clicks still receive 42.3% of all clicks, making premium positions critically important.
Though SERP features like featured snippets, Sponsored Ads, and AI Overviews continue to push organic listings down the page, keywords ranking in the top 3 positions still capture almost half of search traffic.
Strategic Prioritization
While you should ensure keywords already ranking in the top 3 positions stay there, your optimization strategy should prioritize:
High-opportunity keywords: Rankings in positions 4-10 and page two (positions 11-20) represent proven relevance with maximum upside. Moving from position 7 to position 3 requires less effort than from page 5 to page 1, yet delivers disproportionate traffic gains.
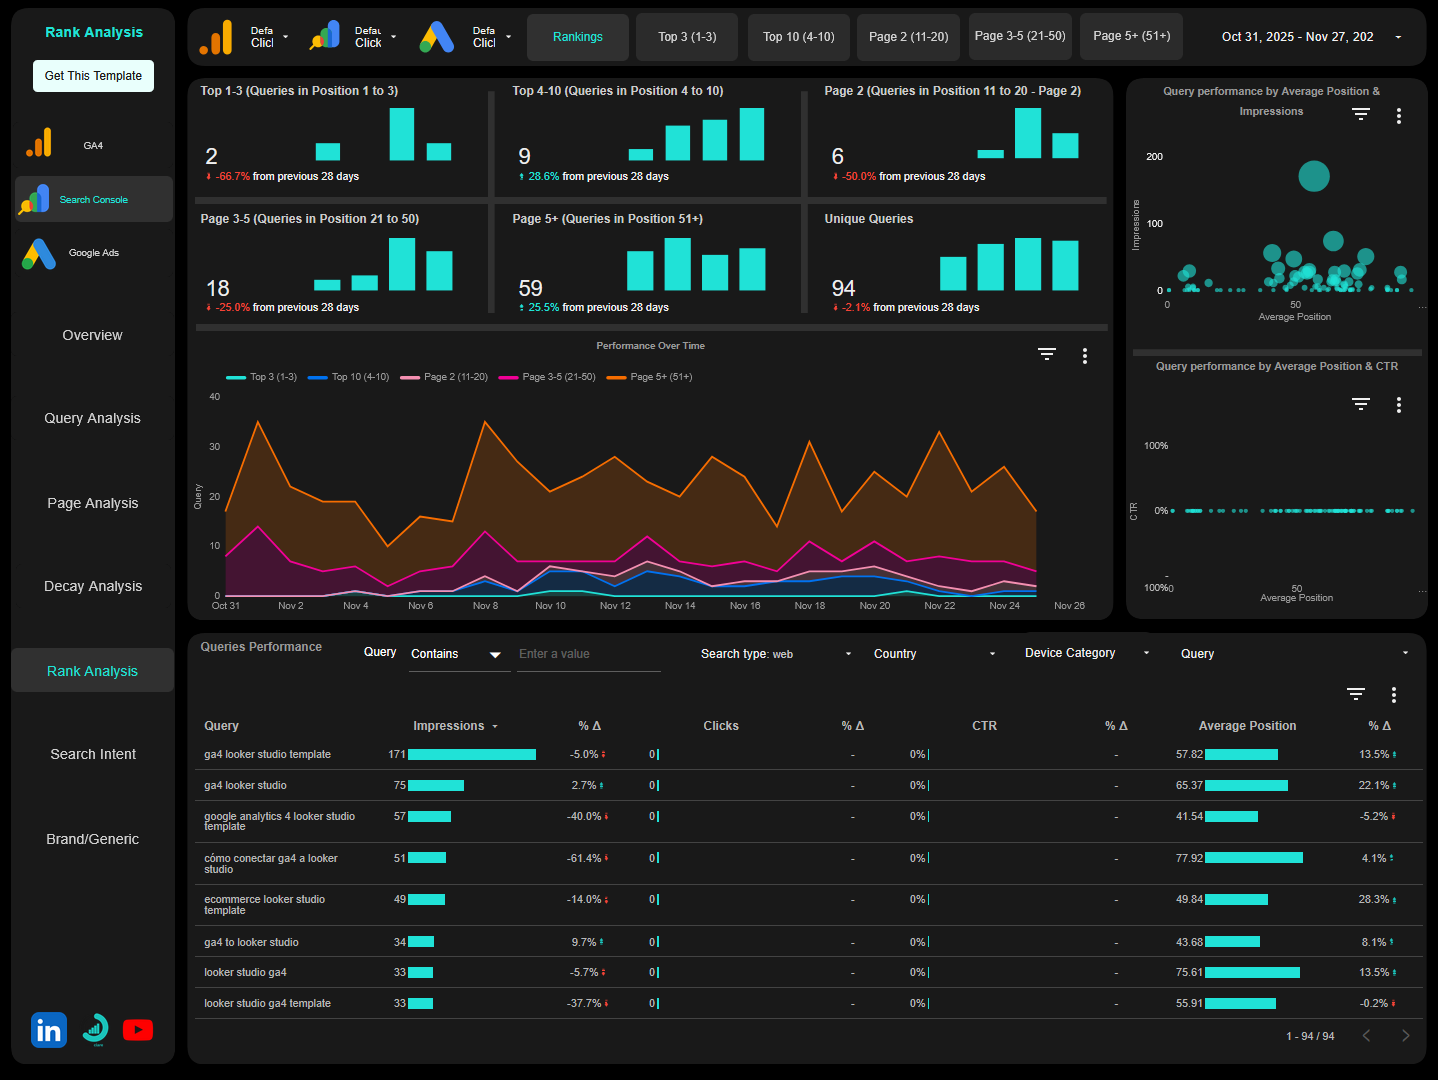
Dashboard Implementation
Your dashboard should segment keywords by position ranges:
- Positions 1-3: Protect and maintain (42.3% of clicks)
- Positions 4-10: High-priority optimization targets
- Positions 11-20: Medium-priority opportunities
- Positions 21+: Content improvement or retirement candidates
Track month-over-month movement to identify momentum and measure the impact of your optimization efforts.
3. Organic Conversions
Traffic means nothing without conversions.
Whether your conversions are e-commerce purchases, lead form submissions, newsletter signups, or content downloads, tracking these actions from organic search visitors is crucial for demonstrating SEO’s business value and return on investment (ROI).
Business Impact
Your SEO dashboard should attribute conversions to specific landing pages that drove them, with further segmentation by:
- Device category – Mobile vs. desktop conversion patterns
- Location – Geographic conversion variations
- Traffic source – Google vs. Bing vs. other search engines
- User type – New vs. returning visitor conversions
- Conversion type – Different goal completions (macro vs. micro conversions)
Strategic Value
This connection between search visibility and business outcomes transforms SEO from a traffic-generation exercise into a revenue-driving channel.
It also helps you identify which content types and topics resonate most with users who are ready to convert.
Advanced tracking: For subscription or SaaS businesses, track the Customer Lifetime Value (CLV) of customers acquired through organic search to understand the long-term financial impact of your SEO investments.
4. Organic Conversion Rate
While total conversions tell you the volume of successful outcomes, your organic conversion rate reveals the quality of your traffic and the effectiveness of your user experience.
Industry Benchmarks
Research shows that the average conversion rate for organic search across all industries is 2.7% (Ruler Analytics, 2025).
However, this varies significantly by sector:
- B2B services: 2.3%
- B2B e-commerce: 1.5%
- Professional services: 5%
- Finance: 2.2%
Understanding these benchmarks helps you contextualize your performance and set realistic goals.
What This Metric Reveals
A declining conversion rate despite growing traffic might indicate that you’re:
- Ranking for increasingly irrelevant keywords
- Attracting informational rather than transactional searchers
- Experiencing landing page users experience issues
- Facing increased competition or pricing pressure
Conversely, improving conversion rates can multiply the value of your existing traffic without requiring additional ranking improvements.
Segmentation Strategy
Segment this metric by:
- Landing page – Identify your highest and lowest performing pages from a conversion perspective
- Device category – Mobile conversion optimization opportunities
- Geographical location – Regional conversion patterns
- New vs. Returning Users – User types conversions rate
Optimization tip: Pages with high traffic but low conversion rates represent quick wins; improving conversion rate here has immediate business impact.
5. Backlinks
Backlinks remain one of the strongest ranking signals in Google’s algorithm, making link acquisition a cornerstone of effective SEO strategies.
The Data Behind Link Building
Research analyzing 11.8 million search results found that the #1 ranking page has an average of 3.8x more backlinks than positions #2-#10 (Backlinko, 2025).
This correlation between backlink quantity, quality, and rankings remains strong in 2025.
Notably, 95% of all web pages currently lack any backlinks, highlighting the competitive advantage a strong link profile provides.
Despite evolving algorithms, 58.1% of businesses consider link building a key factor in improving SERP rankings, and around 85% of marketing experts believe that link building will still be an important ranking factor in 5 years.
What to Track
Your dashboard should monitor:
Quantitative metrics:
- Total number of backlinks
- Number of unique referring domains (diversity matters more than sheer volume)
- New backlinks acquired (monthly/quarterly trends)
- Lost backlinks (identify reclamation opportunities)
Qualitative metrics:
- Ratio of DoFollow to NoFollow links
- Domain Authority/Domain Rating of linking sites
- Topical relevance of linking domains
- Anchor text distribution
- Link placement (editorial vs. footer vs. sidebar)
Monitoring and Alerts
Sudden drops in backlink counts might indicate:
- Lost links that need reclamation
- Competitor link removals
- Technical issues (broken pages, redirects)
Spikes could signal:
- Successful content marketing campaigns
- Viral content performance
- Potential negative SEO that warrants investigation
Tool integration: Connect data from Ahrefs, SEMrush, or Moz to your Data Studio dashboard for automated backlink monitoring.
6. Share of Voice (Traffic Market Share)
Share of voice measures your visibility relative to competitors in your industry or niche; a critical competitive intelligence metric.
This competitive context transforms absolute metrics into relative performance indicators, showing whether you’re gaining or losing ground in your market regardless of overall search volume trends.
Why This Matters
Share of voice is particularly valuable for stakeholder reporting because it demonstrates market position rather than isolated performance. Growing your share of voice proves that your SEO efforts are outpacing the competition, even in a “rising tide” scenario where all players see traffic growth.
Tool recommendations: SEMrush and Ahrefs Rank Tracker integrate well with Data Studio for automated share of voice reporting.
7. Unique Query Count
The number of unique queries (keywords) driving traffic to your site indicates the breadth of your content’s relevance and your success at capturing diverse search demand.
Building Topical Authority
A healthy SEO strategy should steadily increase the number of queries bringing visitors to your site. A growing unique query count suggests:
- Your content addresses a wide range of user needs
- Google understands your website’s topical coverage
- You’re attaining topical authority in your niche
- Your keyword strategy captures long-tail opportunities
Risk Management
Conversely, heavy dependence on a small number of queries creates vulnerability to:
- Algorithm changes targeting specific query types
- Competitive pressure on those specific terms
- Seasonal fluctuations in search demand
- SERP feature cannibalization
Analysis Framework
In your dashboard, track:
Primary metrics:
- Total unique queries driving traffic
- Period-over-Period growth rate
- Query concentration (% of traffic from top 10 queries)
Segmentation:
- Branded vs. non-branded queries
- Commercial vs. informational intent
- Long (4+ words) vs. short query distribution
- New queries acquired this period
8. Unique Pages
This metric tracks the number of indexed pages on your site that appear in search results and receive organic impressions, revealing how much of your site Google considers relevant enough to show to searchers.
Content Visibility Health
A growing number of pages receiving impressions indicates:
- Content production efforts are gaining search visibility
- You’re building topical authority across multiple areas
- Google is indexing and valuing your new content
- Site architecture supports content discovery
When this metric plateaus or declines, it may signal:
- Newer content isn’t being indexed effectively
- Older content is dropping out of the index
- Technical issues preventing pages from appearing in search results
- Content quality issues triggering algorithmic filters
Coverage Analysis
This metric helps you identify what percentage of your total published pages are actually visible in search:
Index Visibility Rate = (Pages with Impressions / Total Published Pages) × 100
Healthy benchmark: 60-80% of published pages should receive at least some impressions quarterly. Lower percentages suggest indexing issues, content quality problems, or internal linking gaps.
Dashboard Implementation
Track in your Data Studio dashboard:
- Total unique URLs with impressions (from GSC)
- Trend over time (monthly)
- Pages with clicks vs. impressions only
- Pages added/lost from impressions month-over-month
- Coverage by content type or site section
9. Organic Revenue
For e-commerce sites and businesses with clear revenue attribution, organic revenue is the ultimate SEO metric.
This figure represents the actual financial value generated by your organic search channel, typically tracked by integrating Google Analytics 4 with your e-commerce platform via Google Tag Manager and set-up an enhanced e-commerce tracking.
Complete Performance Picture
Monitoring organic revenue alongside traffic and conversion metrics creates a complete picture of SEO performance. You might discover:
- High traffic, low revenue pages: Popular but not commercially valuable; optimize for conversions
- Low traffic, high revenue pages: Hidden gems; invest in ranking improvements for outsized returns
- High Average Order Value (AOV) segments: Demographic or product categories worth targeting
- Revenue per session trends: Overall commercial performance of organic channel
Dashboard Visualization
Your SEO dashboard should display:
- Organic revenue trend line
- Revenue by landing page (top performers)
- Revenue by device category
- Revenue by product category or service line
- Organic revenue as % of total revenue
10. Click-Through Rate (CTR)
CTR indicates how compelling your titles and meta descriptions are, as well as how well your result stands out in the SERPs against both organic competitors and SERP features.
Why CTR Matters
Improving CTR can increase traffic without requiring higher rankings; making it a high-leverage optimization opportunity.
Optimization Opportunities
Monitor CTR from Google Search Console and identify pages where strong rankings yield disappointing click-through performance; these represent quick optimization wins.
CTR improvement tactics:
- Title tag optimization: Include target keyword, power words, numbers
- Meta description enhancement: Clear value proposition, call-to-action
- Rich snippet implementation: Reviews, FAQs, How-tos via schema markup
- URL optimization: Clean, descriptive URLs
- Date freshness signals: Update content, show publish/update dates
Dashboard Analysis
Track in Data Studio:
- Average CTR by position bucket (1-3, 4-10, 11-20)
- CTR by page/query
- CTR trend over time
- Pages with position-to-CTR gaps (underperformers)
- Mobile vs. desktop CTR comparison
Red flag: Position #3 with 3% CTR suggests title/description issues or strong competitor SERP features stealing clicks.
Bringing It All Together: The Power of Centralized Dashboards
Tracking these metrics across different platforms creates inefficiency, blind spots, and incomplete insights:
- Google Search Console provides query and ranking data but not conversion tracking
- Google Analytics 4 shows traffic and conversions but not backlinks and competitor analysis
- Third-party SEO tools offer backlink analysis and visibility tracking but don’t integrate with your actual business outcomes.
This fragmentation means you’re constantly switching contexts, manually correlating data, and missing the connections between metrics that reveal true performance drivers.
Why Data Studio (formerly Looker Studio) Changes Everything
This is where Data Studio becomes invaluable. As a free, flexible business intelligence platform, it connects all your data sources:
- Google Search Console
- Google Analytics 4
- Google Ads (for paid/organic comparison)
- SEO tools like SEMrush, Ahrefs, Moz
- Your own databases and CRM systems
- BigQuery for advanced analysis
- Third-party connectors for specialized data
You can build customized dashboards that display all ten of these critical metrics in a single view, updated automatically and shareable with stakeholders.
Visual Intelligence and Data Storytelling
The visual nature of Data Studio dashboards transforms raw data into actionable insights:
- Line graphs reveal traffic trends over time and seasonality patterns
- Bar charts compare performance across device categories, locations, and segments
- Scorecards highlight your most important KPIs at a glance
- Geographic maps show where your traffic originates and conversion hotspots
- Tables drill into page-level, keyword-level, or campaign-level details
- Combo charts correlate multiple metrics (rankings + traffic + revenue)
All of these update automatically as new data flows in, eliminating manual reporting work and ensuring decisions are based on current, accurate information.
The Narrative Advantage
Perhaps most importantly, a well-designed dashboard tells a story. It connects:
- Rankings → Traffic
- Traffic → Conversions
- Conversions → Revenue / Business outcome
It shows not just what’s happening but why it’s happening and what it means for your business.
This narrative capability makes reporting to executives and clients far more impactful than presenting spreadsheets of disconnected numbers.
Instead of asking stakeholders to interpret data, you’re presenting insights with clear business implications.
Ready to Upgrade Your SEO Reporting and Analysis?
If you’re convinced that centralized SEO tracking is essential but feel overwhelmed by the technical complexity of building these dashboards from scratch, you’re not alone.
Creating effective Data Studio dashboards requires expertise in:
- Data source connections
- Calculated fields and custom metrics
- Data blending across multiple sources
- Dashboard design and data visualization best practices
- Filter configuration
That’s where we comes in. We provide two solutions to get you from data fragmentation to actionable insights:
Option 1: Ready-to-Use Templates
I’ve developed ready-to-use SEO templates for Data Studio (formerly Looker Studio) that implement these best practices out of the box. These templates:
- Connect instantly to your Google Search Console and Google Analytics 4
- Visualize most of the core metrics discussed in this guide
- Feature pre-built filters, segments, and date comparisons
- Are designed by SEO professionals for SEO professionals
- Provide layouts that facilitate quick insights and informed decision-making
- Update automatically as new data flows in
- Are fully customizable to your specific needs
Professional dashboards ready in minutes.
Perfect for: SMBs, in-house SEO teams, agencies managing multiple clients, anyone who wants professional dashboards without the learning curve.
Option 2: Custom SEO Dashboard Development
For businesses with unique tracking needs or those seeking a truly customized solution, we offer custom SEO Data Studio dashboard development services.
This bespoke approach creates dashboards tailored to:
- Your specific metrics and KPIs
- Your brand guidelines and design preferences
- Your unique data sources and integrations
- Your stakeholder reporting requirements
- Your segmentation and filtering needs
Whether you need to:
- Integrate proprietary data sources
- Calculate custom metrics and dimensions
- Blend data from multiple SEO tools
- Build multi-page reports for different audiences
- Create automated client reporting systems
- Implement advanced features like BigQuery integration
Custom development ensures your dashboard perfectly fits your workflow and delivers exactly the insights your business requires.
Bespoke solutions for unique needs.
Perfect for: Enterprise organizations, agencies with specific client needs, businesses with complex data ecosystems, companies requiring advanced analytics capabilities.
Take Action Today
- Stop jumping between platforms to understand your SEO performance.
- Stop manually compiling reports from disconnected data sources.
- Stop missing the connections between metrics that reveal true performance drivers.
Bring all your critical SEO metrics together in one powerful, visual, automatically updating dashboard.
Your future self and your stakeholders will thank you.
Transform your SEO reporting from a time-consuming chore into a strategic advantage that drives data-informed decisions and demonstrates clear business value.
A Data Studio expert that help e-commerce and marketing teams transform their business data into an actionable Data Studio dashboard that cuts hours of manual reporting and delivers real-time business insights.