Free Data Studio Templates Free Downloads
Make a Copy of GA4 CRO, eCommerce, and Search Console Dashboards for Free
Get instant clarity on funnel leaks, frictions in buyers journey, eCommerce store performance, and organic traffic.
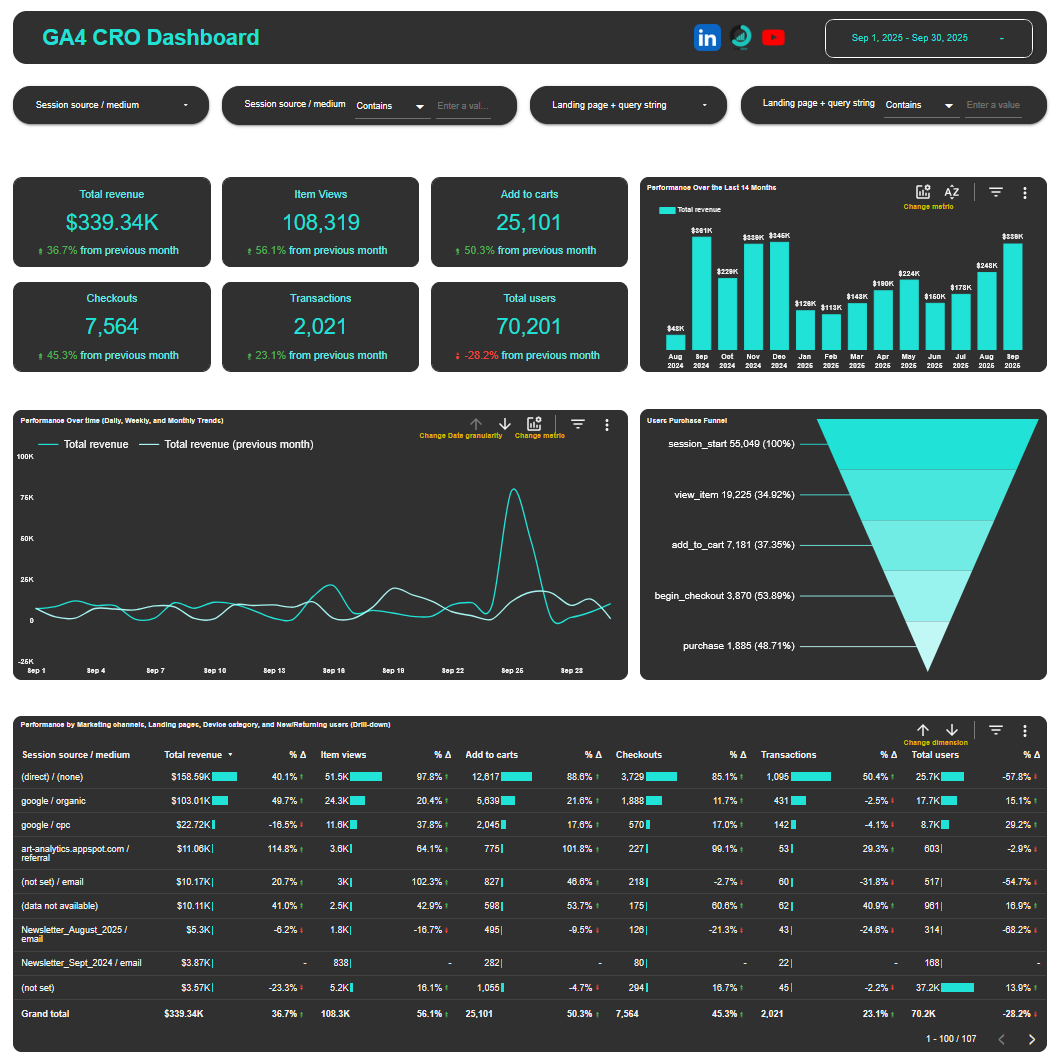
Free GA4 CRO Data Studio Template
Start seeing the insights that actually improve conversion and recover lost revenue for you online store.
$0
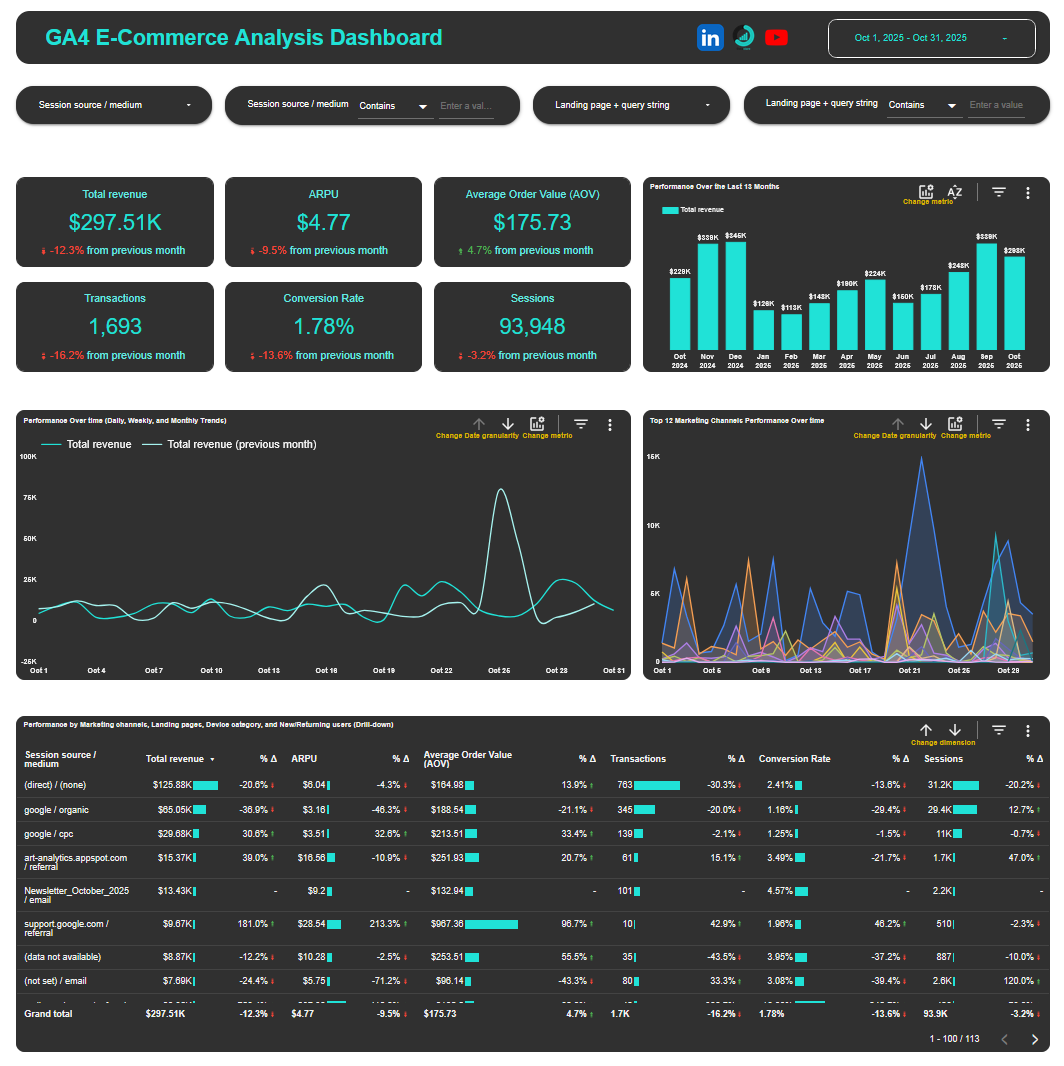
Free GA4 Revenue Analysis Data Studio Template
Spot revenue leaks, identify weak points, hidden opportunities, and make faster decisions that drive growth
$0
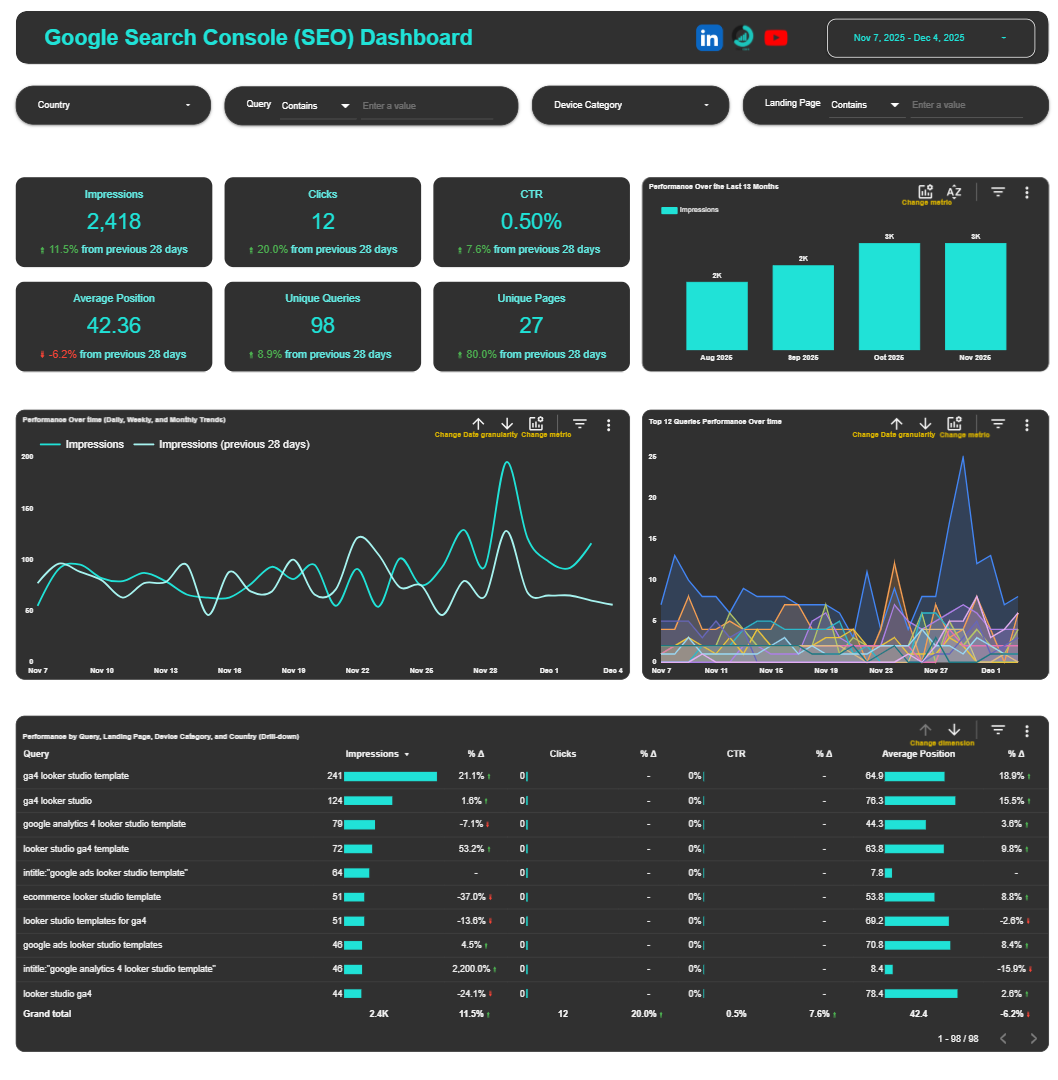
Free Search Console Data Studio Template
Transform Search Console Data Into Actionable Insights. Know which queries, pages are sending organic traffic.
$0
1.) The CRO Template
1. Revenue (Your North Star KPI): The outcome you’re trying to grow.
2. Items Viewed → Add-to-Carts → Checkouts: Shows how users progress, and where they fall off.
3. Transactions and Total Users: Pinpoint whether the issue is traffic quality, product engagement, or checkout friction.
Real Decision-Making Example
If revenue drops, your current dashboard likely can’t tell you why.
With this template, you can see immediately:
- Total Users ▼ 7% → Traffic concern. Check channels, campaigns, and landing pages.
- Items Viewed ▲ 4% → Product engagement is healthy
- Add-to-Cart ▼ 11% → Product pages aren’t convincing. Investigate pricing, trust signals, images, and descriptions.
- Checkouts ▲ 2% → Checkout is not the bottleneck. If this drops, evaluate UX, forms, fees, and shipping.
In 30 seconds, you now know:
→ What broke
→ Where to fix
→ What to test
No guesswork.
Just clarity → action → growth.
2.) The Revenue Analysis Template
→ Revenue (Your North Star Metric): The outcome everything should point toward.
→ AOV and ARPU (Revenue Efficiency Metrics): Increase these and you grow revenue without extra traffic.
→ Transactions, Conversion Rate & Sessions (Diagnostic Metrics): Pinpoint the root cause of any performance change.
Know Why Revenue Goes Up or Down
If revenue drops, this dashboard instantly tells you whether the problem is:
- Traffic (Sessions)
- Conversion Rate
- Order Size (AOV)
- Retention (ARPU)
No more guessing.
Example: Real Decisions in 30 Seconds
Revenue is down this week:
- Sessions: ▼ 12%
- Conversion Rate: ▲ 3%
- AOV: ▼ 9%
Meaning:
- Traffic decreased, but quality improved
- Buyers are spending less
Action plan:
- Push campaigns with higher conversion efficiency
- Add bundles, upsells, or product incentives
Clarity → Action → Growth.
3.) The Search Console Template
Your Search Console Has Goldmine Data.
But Let’s Be Honest.
The native interface isn’t built for quick decision-making.
You’re probably:
- Jumping between multiple tabs to check SEO metrics
- Manually exporting data to build reports
- Spending hours creating dashboards from scratch
- Struggling to identify quick wins in your data
- Wasting time on repetitive reporting tasks
There’s a better way.
- One Dashboard
- All Your SEO Metrics
- Always Up-to-Date.
This plug-and-play Data Studio template does the heavy lifting for you:
Track clicks, impressions, CTR & rankings in one view: See your complete performance overview without switching tabs
Identify your top-performing pages instantly: Know exactly which content drives traffic and which needs optimization
Spot your top performing queries: Discover where your queries are ranking on the google search engine result pages.
Monitor mobile and desktop performance: Understand how your real audience interacts with your site
No setup hassle – connect and go: Auto-updates with your latest GSC data. Takes 2 minutes to set up. Saves you hours every week.
Share reports with clients/teams in seconds: Generate professional reports without design skills.