How to Fix the This Data Has Been Accessed Too Many Times Error in Looker Studio
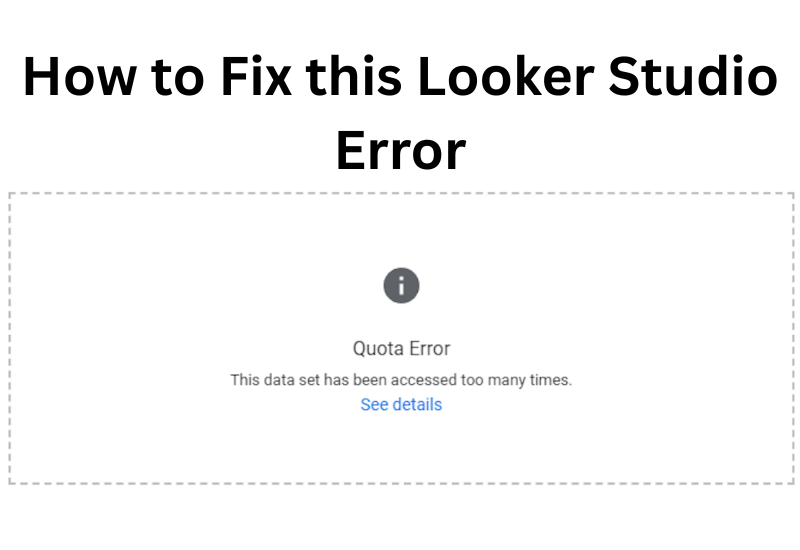
If you’ve worked with Looker Studio (formerly Google Data Studio) long enough, you have probably encountered the frustrating “This data has been accessed too many times” error message at some point.
This error can bring your reporting workflow to a halt, leaving you wondering what went wrong and how to get back on track.
Don’t worry, this is a common issue in Looker Studio, and fortunately, there are several effective ways to resolve it.
In this comprehensive guide, we’ll explore what causes this error and provide you with practical solutions to fix it and prevent it from happening again.
Understanding the Error: What’s Really Happening?
Looker Studio dashboards connect to data sources like Google Sheets, GA4, and Google Ads. Every time you (or a viewer) load a dashboard, Looker Studio sends queries to the source.
This Data has been accessed too many times error occurs when your Looker Studio reports exceed the query or request limits imposed by your data source.
Think of it as a traffic control system; data sources like Google Analytics and Google Ads have built-in quotas to prevent system overload and ensure fair usage across all users.
When you hit these limits, the data source temporarily blocks additional requests, triggering this error message in Looker Studio.
This isn’t a bug or a malfunction; it’s actually a protective mechanism designed to maintain system stability.
Common Causes of This Data has Been Accessed too Many Times Error in Looker Studio
1.) Daily Query Limits Exceeded
Most data sources have daily quotas that reset at midnight.
Heavy usage throughout the day can quickly consume these limits, especially if you’re working with multiple reports or have many team members accessing the same data.
2.) Too Many Concurrent Users
When multiple people access the same report simultaneously, each view generates queries to the data source.
During peak usage times, this can quickly overwhelm the available quota.
3.) Resource-Intensive Report Design
Complex reports with numerous charts and calculated fields, extensive filters, or large date ranges require more processing power and consume quota faster than simple reports.
Every chart runs its own request to the data source.
A page with 20 charts doesn’t just look busy; it’s also hammering your source with 20+ near-simultaneous requests.
Add tables with breakdowns or time series with multiple dimensions, and the load multiplies.
Date range selectors, drop-down filters, and optional metrics are useful, but they trigger new requests every time they’re adjusted.
If you layer multiple filters (e.g., Date + Country + Device), Looker Studio may need to re-run all underlying queries together, creating a surge of requests.
4.) Automatic Refresh Settings
Reports set to refresh frequently will continuously query the data source, eating up your daily allowance even when no one is actively viewing the dashboard.
Solutions to Get Back Up and Running
1.) The Waiting Game (Often the Simplest Fix)
Sometimes the best solution is the most straightforward one: wait. Daily quotas typically reset at midnight, so if you’re hitting daily limits, waiting until the next day often resolves the issue immediately.
For temporary rate limits (rather than daily quotas), waiting just a few hours can be sufficient.
2.) Reduce Report Complexity
Streamline your reports to reduce the query load.
a.) Split dashboards into Pages: Instead of one heavy page with 30+ charts, have multiple pages like Overview, Acquisition, and Conversion pages.
b.) Remove non-essential charts and visualizations: Keep pages lean, 8 to 10 well-optimized charts is a good range.
If you need to add more charts, make sure they do not change with the use of a filter or date control (an example is the last 6 or 12 months trends).
Reduce the number of default columns on tables, use optional metrics and drill-down features instead.
c.) Narrow down date ranges to focus on recent data. Avoid large default date ranges (e.g., “Last 3 years”).
d.) Simplify complex calculated fields
e.) Reduce the number of active filters. Only keep filters that users actually need
f.) Consider scheduling regular report deliveries instead of having users constantly access live dashboards.
3.) Adjust Data Freshness Settings
In your data source configuration, increase the data freshness interval. Instead of querying for new data every 15 minutes, consider setting it to hourly or even daily updates, depending on your reporting needs and data source.
4.) Move Your Data to BigQuery
BigQuery is built for high-performance analytics and has much higher quotas than Sheets or APIs.
- Export your GA4 data to BigQuery (Google provides a free export)
- Import large Google Sheets files into BigQuery
- Connect Looker Studio to BigQuery for smooth, scalable dashboards.
Final Thoughts
The This data has been accessed too many times error in Looker Studio is a sign that your dashboards are pulling too much live data.
The key is to reduce the number of queries, either by moving to BigQuery or optimizing your dashboard structure.
With the above tweaks, you’ll keep your dashboards running smoothly; no more embarrassing errors in front of clients or teammates.
Instead of spending hours building Looker Studio dashboards from scratch, you can save time with Data Clare’s ready-to-use templates.
Browse Data Clare’s templates
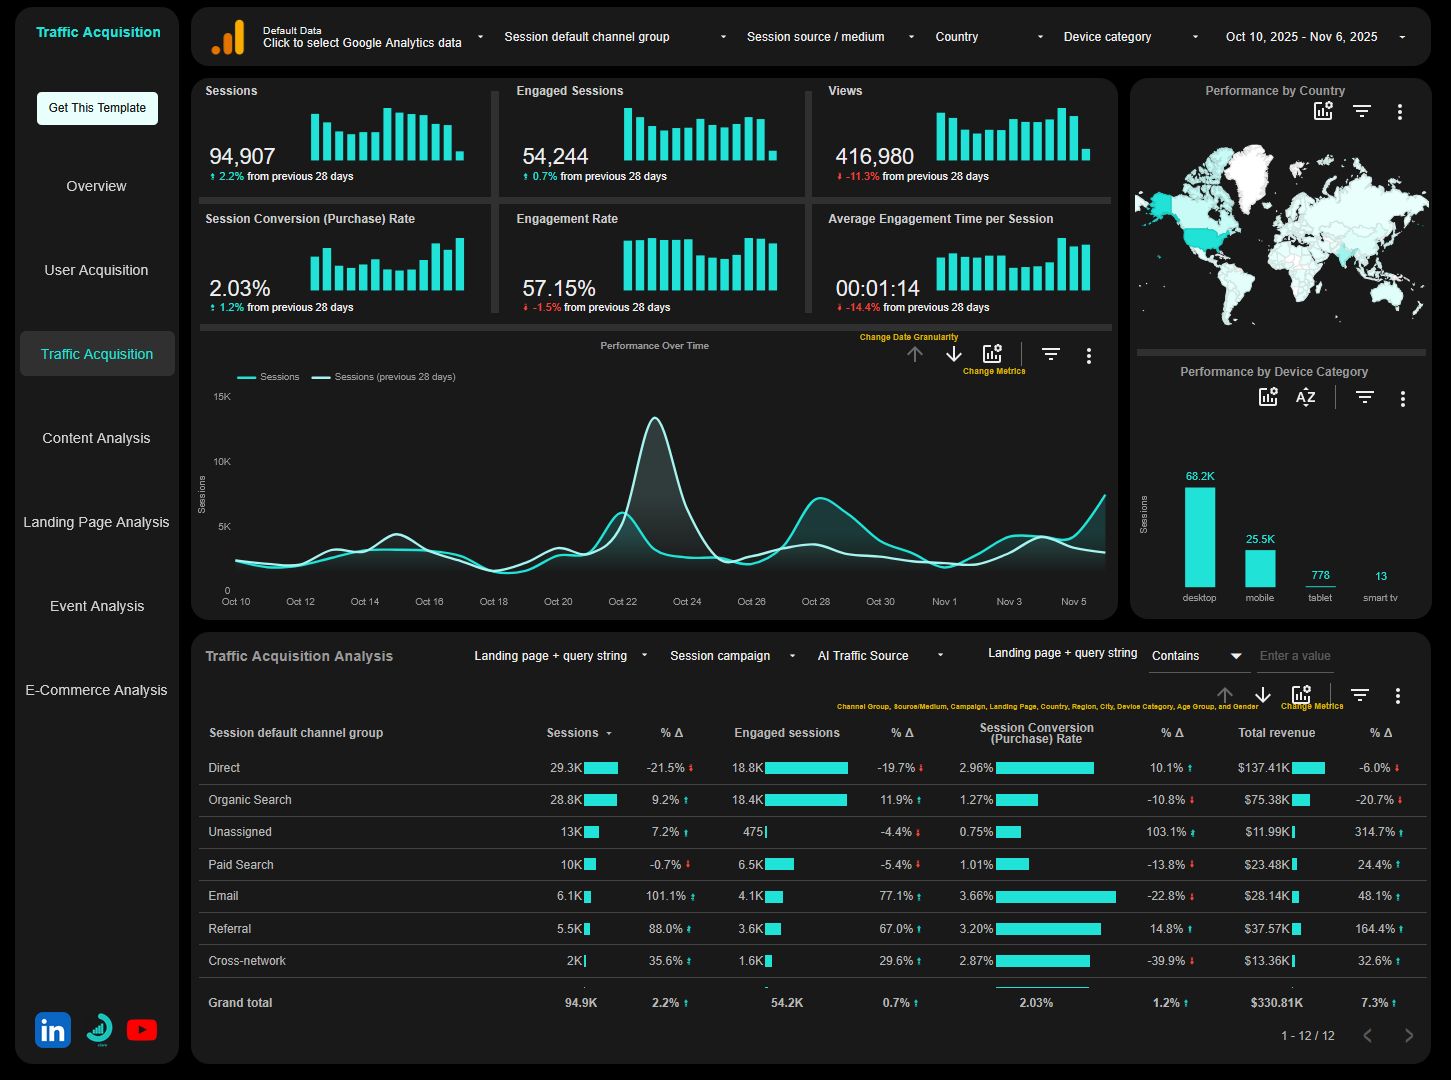
Google Analytics 4 Looker Studio Report Template
Goodbye to GA4 cluttered interface. Get a clean, automated dashboard that reveals your traffic, engagement, and conversions, all in one place, ready to share.
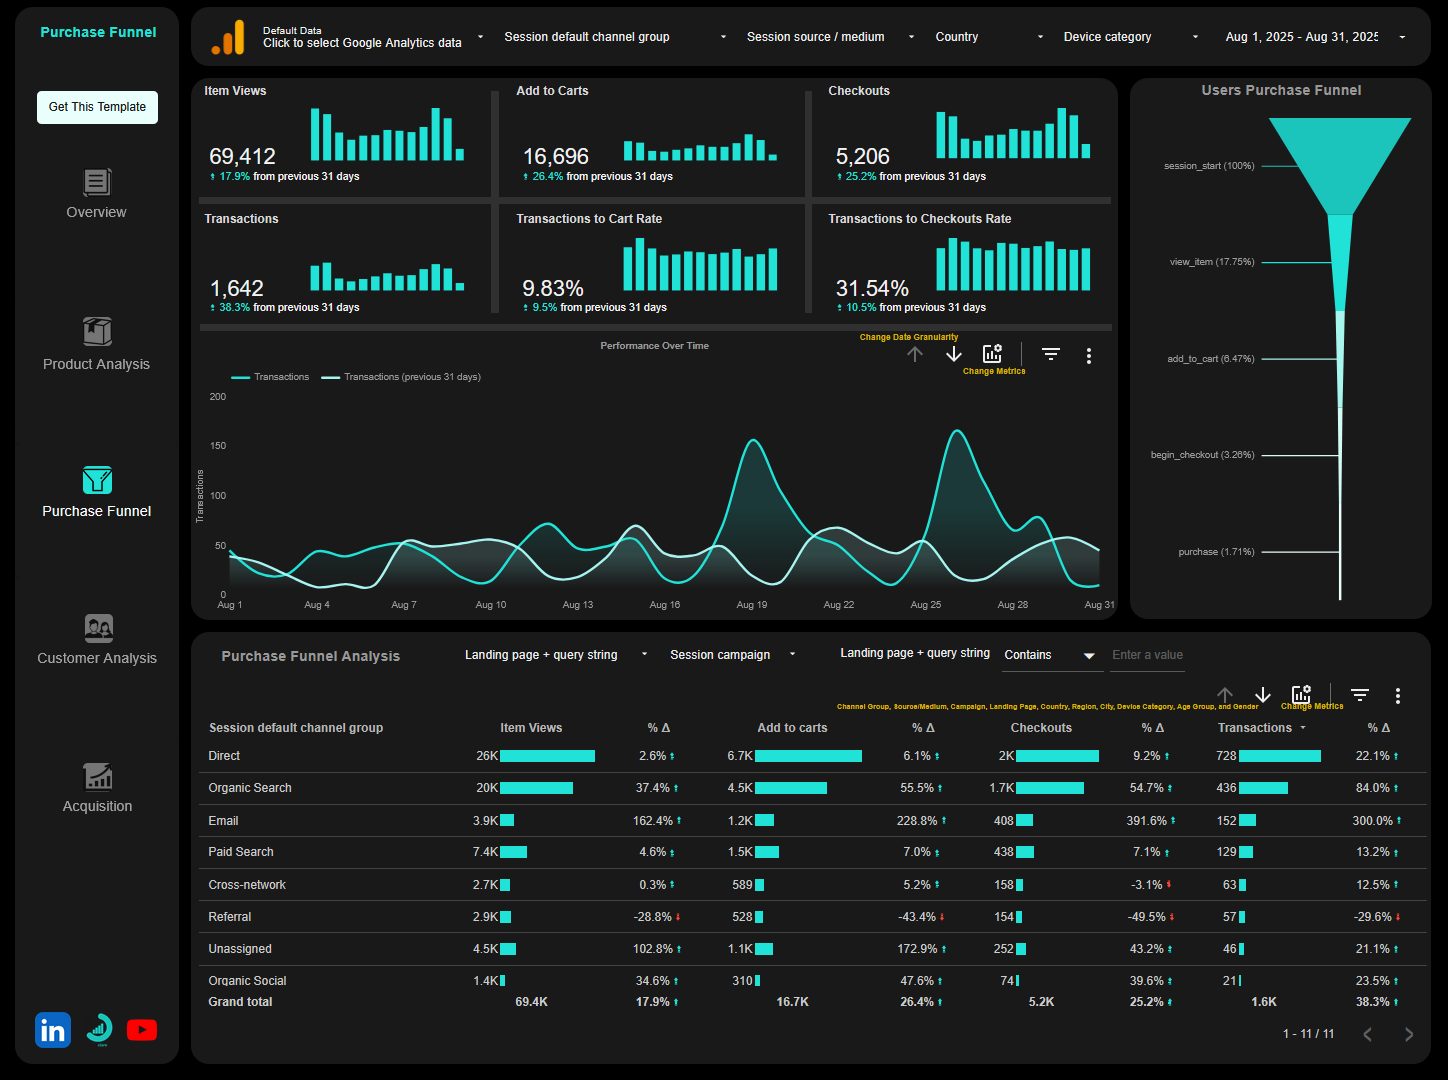
Google Analytics 4 E-Commerce Looker Studio Report Template
See your store’s performance at a glance. From revenue to top-selling products, this dashboard turns GA4 e-commerce data into insights that drive sales.
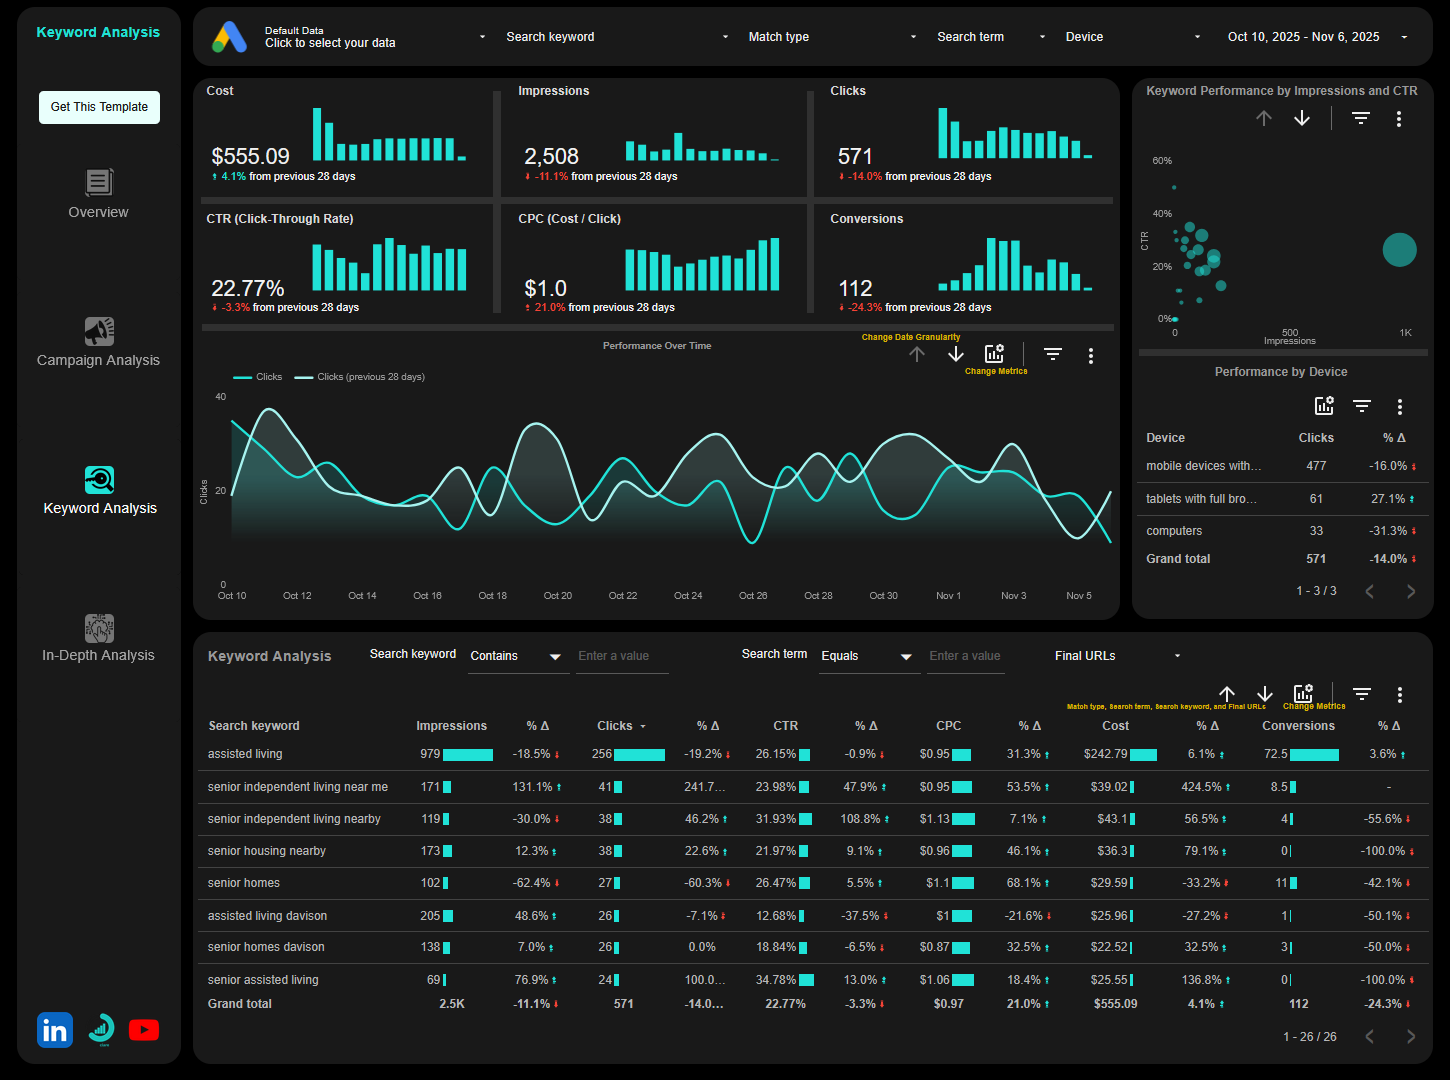
Google Ads Looker Studio Report Template
Monitor Clicks, Cost, CTR, CPC, and conversions in one sleek dashboard. Pinpoint winning keywords, ads, and campaigns so you can maximize ROI and cut wasted ad spend.
I help e-commerce, sales, and marketing teams transform their business data into an actionable Looker Studio dashboard that cuts hours of manual reporting and delivers real-time business insights.